Emiliano Rossi ID
Cardiologist. Research Department. Hospital Italiano de Buenos
Aires.
Ciudad Autónoma de Buenos Aires, Argentina.
Acta Gastroenterol Latinoam 2023;53(4):334-336
Received: 14/11/2023 / Accepted: 19/12/2023 / Published
online 29/12/2023 /
https://doi.org/10.52787/agl.v53i4.365
In clinical trials where the aim lies in observing the occurrence of new events during the follow-up period, the main focus is usually on the time elapsed until the initial event occurs. If this initial event is non-fatal, adopting this approach means that information from subsequent incidents will be lost. However, when capturing the effect of treatment on the total burden of disease is of interest, it is recommended to include recurrent events into analysis. Recurrent events are defined as endpoints that occur after the initial event, as determined by researchers. Examples include readmissions, undergoing specific procedures, clinical worsening, and death during the follow-up period.
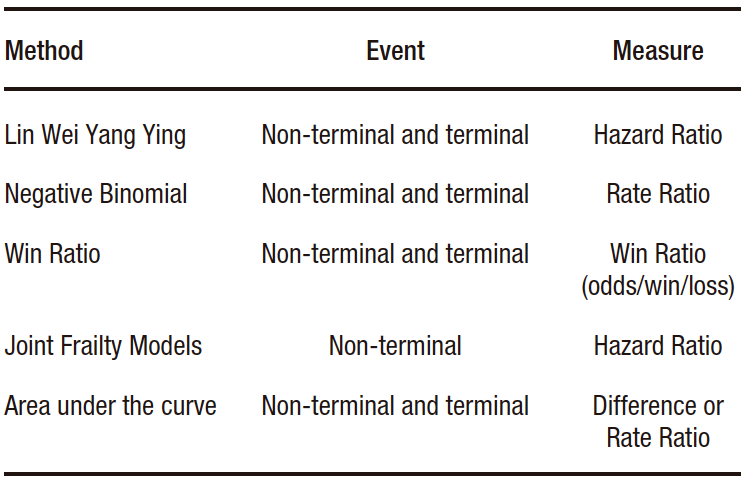
There are different statistical methods available to analyze recurrent events in the context of clinical trials.1-2 Those most widely currently used ones are (Table 1):
Table 1. Statistical methods to analyze recurrent events
a) The Lin Wei Yang Ying (LWYY) model. It is an extension of the Cox model. It offers the advantage of allowing events that are not independent to be modeled, since it considers the grouping of events in high-risk patients. It also allows modeling terminal events, that is, those after which individuals are no longer at risk (e.g. death). Its disadvantages include assuming non-informative censoring between events (the absence of survival information for one event is unrelated to another) and assuming proportional hazard ratios for the entire follow-up period.
b) The negative binomial model. It is an extension of the Poisson model. Its advantage over it is that it relaxes some of its assumptions, such as having a fixed event rate during the follow-up period, and having the same event rate in all individuals. It allows for estimating and comparing incidence rates. Similar to the LWYY model, it enables the modeling of terminal events but assumes non-informative censorship between events as a disadvantage.
c) Win Ratio. It is a method that allows including recurring events by ranking the components of the endpoint. It compares, through matching, each patient in the intervention group with those in the control group. In each control-intervention pair, the incidence of the components of the endpoint is evaluated in descending order of importance (e.g. 1st: death, 2nd: hospitalization, 3rd: improvement on a quality of life scale), and the result in each pair is categorized as “win”, “loss” or “draw”. The Win Ratio is calculated as the total number of wins over the total losses of the intervention group. If value is greater than one, the result is in favor of the intervention. If the effect is to be compared with that estimated by other measures, such as relative risk or hazard ratio, it should be expressed as 1/Win Ratio.
d) Joint Frailty Models. They allow estimating the risk of recurrent events in the presence of a terminal event, although they only estimate the hazard ratio of non-fatal events. In other words, they do not allow terminal events to be included in the combined endpoint. They calculate the risk of experiencing recurrent events considering the coexistence of the risk of the occurrence of terminal event. In most clinical situations, patients at high risk of non-fatal events are at greater risk of experiencing a fatal event.
e) Area under the curve (AUC). It is a restricted mean survival time extension. Its advantage lies in its lack of statistical assumptions. Its disadvantage is that a fixed monitoring period must be established, so events that occur subsequently will not be taken into account. The AUC estimates the time elapsed between the event and the end date of monitoring ("lost time"), for each event. Subsequently, these times are added in each patient and averaged in each study group. It can be presented in absolute form, as the difference in time, or in relative form, as a ratio of time between the intervention and control groups. The event-time average equals the area under the cumulative incidence curve of events. It should be considered that events occurring late during follow-up contribute minimally to its estimation.
Gregson et al. recently published a review on the methodology for analyzing recurrent events.1 They compare the results of applying the aforementioned methods to data from different cardiovascular clinical trials. For example, in the case of the EMPEROR-Preserved study, which was a study that randomized patients with heart failure and preserved ejection fraction to receive empaglifozin (n=2,997) or placebo (n=2,991) and whose primary endpoint was the incidence of cardiovascular death or hospitalizations due to heart failure, a total of 1,411 events were observed (463 deaths and 948 hospitalizations due to heart failure).3 Among these, 926 were first events, and 485 were recurrent events. As usually observed in clinical settings, most patients experienced either one event or none. Only a few had several events. It was observed that the active treatment arm presented a lower number of events compared to the control arm. Table 2 presents the effect measures and their corresponding confidence intervals for each of the methods described. In this case, the results were similar. In other situations, depending on the nature of the events under study and the assumptions of the models, the results may differ.
Table 2. Comparison of effects estimated by different methods of
analysis of recurrent events in the EMPEROR-Preserved study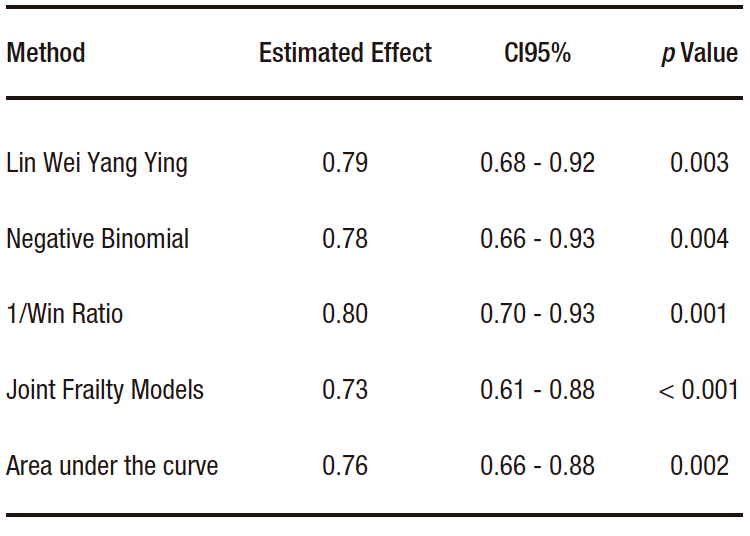
Some considerations to take into account when choosing an analysis method for studies aimed at evaluating the occurrence of events during follow-up:
• In patients without established disease, the main goal of treatment is to prevent the onset of the disease. Therefore, the analysis of time until the first event is an appropriate option (e.g. Cox model).
• In patients with a chronic disease, the main goal of treatment is to reduce the total number of events during the follow-up period. Analyses that include recurring events are more useful.
• In patients with advanced-stage disease, quality of life is relevant. The Win Ratio allows quality of life measures to be combined with the incidence of fatal and non-fatal events.
Intellectual Property. The author declares that the data and tables presented in the manuscript are original and were carried out at his belonging institution.
Funding. The author declares that there were no external sources of funding.
Conflict of interest. The author declares that he has no conflicts of interest in relation to this article.
 © 2023 Acta Gastroenterológica latinoamericana. This is an
open-access article released under the terms of the Creative Commons Attribution (CC BY-NC-SA 4.0) license,
which allows non-commercial use, distribution, and reproduction, provided the original author and source are
acknowledged.
© 2023 Acta Gastroenterológica latinoamericana. This is an
open-access article released under the terms of the Creative Commons Attribution (CC BY-NC-SA 4.0) license,
which allows non-commercial use, distribution, and reproduction, provided the original author and source are
acknowledged.
Cite this article as: Rossi E. Introduction to the Analysis of Recurrent Events in Clinical Trials. Acta Gastroenterol Latinoam. 2023;53(4):334-336. https://doi.org/10.52787/agl.v53i4.365
Correspondence: Emiliano Rossi
Email: emiliano.rossi@hospitalitaliano.org.ar
Acta Gastroenterol Latinoam 2023;53(4):334-336